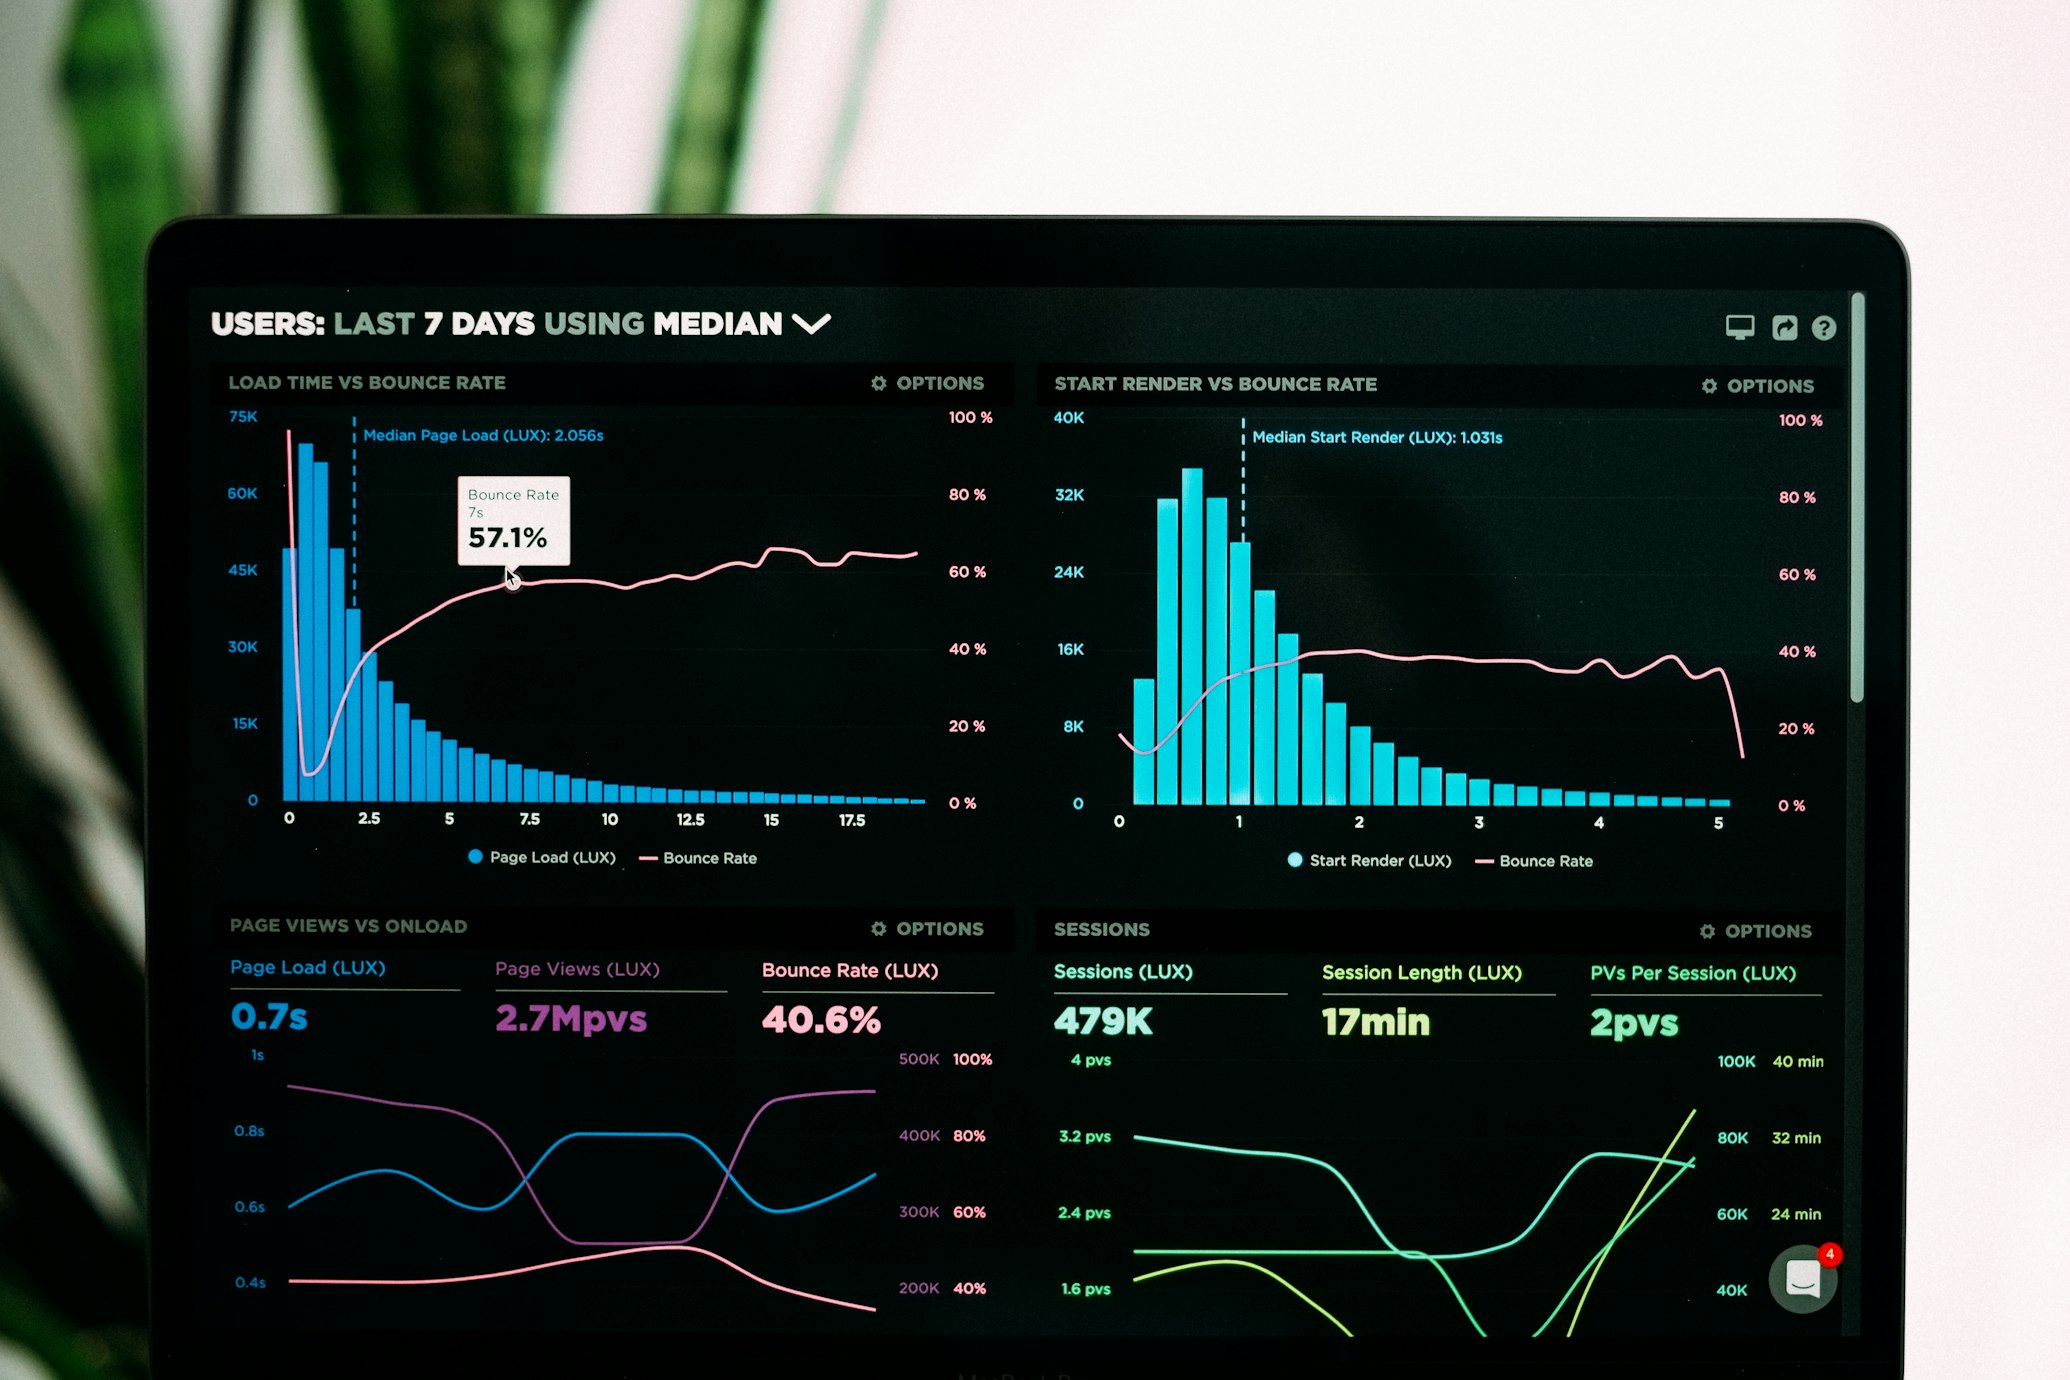
You have a Stripe dashboard for revenue. A HubSpot dashboard for sales. A Google Analytics dashboard for traffic. And a Jira dashboard for product.
You are drowning in data, but you are starving for insights.
The modern CEO’s problem isn’t a lack of information. It’s the friction of retrieving it.
Every morning, you perform a “login patrol”—opening 10 tabs, refreshing 10 pages, mentally stitching together a picture of your company’s health.
It’s manual. It’s slow. And because it’s high-friction, you eventually stop doing it. You start flying blind.
There is a better way. It’s called a CEO Command Room.
And in 2026, you don’t need to pay McKinsey $500k to build one. You can build it yourself in a weekend with three tools: n8n, Supabase, and an LLM.
The Concept: From “Pull” to “Push”
✗ Traditional Dashboard (Pull)
✓ Command Room (Push)
Imagine this: At 8:00 AM, you receive a single notification (Email, Slack, or WhatsApp). It says:
Morning Briefing
Vital Signs:
- Cash: $124,000 (▼ 2% from last week)
- MRR: $45,200 (▲ $1.2k new yesterday)
- Churn: 0 users yesterday.
Attention Required:
- Lead volume dropped 15% yesterday. Likely due to LinkedIn ads pausing.
- Server latency spiked at 3 AM. Engineering is investigating.
- Big prospect (Acme Corp) clicked pricing page 4 times. Time to follow up?
This isn’t a chart. It’s a briefing. It tells you what happened, why it matters, and what to do next.
The Architecture
Here’s how the data flows:
┌─────────────────────────────────────────────────────┐
│  DATA SOURCES (Stripe, HubSpot, GA4)                │
└──────────────────────┬──────────────────────────────┘
                       │ Raw Data
                       ▼
┌─────────────────────────────────────────────────────┐
│  n8n WORKFLOW                                       │
│  - Harvests data nightly                            │
│  - Stores snapshots in Supabase                     │
│  - Calculates trends (WoW, MoM)                     │
│  - Passes context to AI                             │
└──────────────────────┬──────────────────────────────┘
                       │ Context + New Data
                       ▼
┌─────────────────────────────────────────────────────┐
│  AI ANALYST (Claude/GPT)                            │
│  - Compares to historical baseline                  │
│  - Flags anomalies                                  │
│  - Explains likely causes                           │
│  - Suggests actions                                 │
└──────────────────────┬──────────────────────────────┘
                       │ Synthesized Briefing
                       ▼
┌─────────────────────────────────────────────────────┐
│  YOU (Slack, Email, WhatsApp)                       │
└─────────────────────────────────────────────────────┘
The Project Structure
▸ 📁 ceo-command-room
▸ 📁 supabase
- 📄 schema.sql Database definitions
- 📄 seed.sql Test data
▸ 📁 n8n-workflows
- 📄 daily-harvest.json Pulls raw data
- 📄 intelligence-briefing.json AI analysis logic
- 📄 prompts.md The system prompts for the analyst
- 📄 .env API Keys (Stripe, OpenAI)
Step 1: The “Snapshot” Database
APIs only give you “current state” (e.g., Stripe Balance). They don’t tell you “Stripe Balance vs. 30 Days Ago”. You need a place to store daily snapshots so you can calculate trends.
Create a simple table in Supabase:
-- Store daily business metrics
create table daily_metrics (
  date date primary key default current_date,

  -- Financials
  revenue_total numeric,
  cash_balance numeric,

  -- Growth
  new_customers int,
  active_users int,
  churn_count int,

  -- Metadata
  notes text,
  created_at timestamp with time zone default now()
);

-- Enable Row Level Security
alter table daily_metrics enable row level security;
Step 2: The Harvest Workflow (n8n)
Build a workflow that runs every night at 2 AM. It queries your tools and inserts a row into Supabase.
// n8n Code Node: Format Data for SQL Insert
const stripeData = items[0].json;
const hubspotData = items[1].json;

return {
  json: {
    date: new Date().toISOString().split('T')[0],
    revenue_total: stripeData.balance.available[0].amount / 100,
    cash_balance: stripeData.balance.pending[0].amount / 100,
    new_customers: hubspotData.contacts.length,
    active_users: 450,
    churn_count: stripeData.churned_subscriptions || 0
  }
};Start with just 2-3 data sources. Stripe + your CRM is enough. Add more later when the system is working.
Step 3: The “Intelligence” Prompt
This is where you replace the Data Analyst. Pass Yesterday’s Metrics and 30-Day Average to the LLM:
You are the Chief of Staff for a Series A startup. Your job is
to analyze daily metrics and write a briefing for the CEO.

**Context:**
- We sell B2B SaaS software
- Our main goal this quarter is reducing churn

**Input Data:**
- Yesterday's Revenue: {{ $json.revenue }}
- 30-Day Average: {{ $json.avg_revenue }}
- Variance: {{ $json.variance }}%

**Instructions:**
1. Start with "Vital Signs" (bullet points of key numbers)
2. Flag any "Anomalies" (deviations > 10%). Explain WHY if possible
3. Be brief. Use bolding for numbers. Tone: Professional, directThe prompt is everything. Spend time on it. Bad prompt = useless briefing. Good prompt = your AI Chief of Staff.
Why This Beats a Dashboard
Dashboards Hide Problems
✓ Briefings Force Clarity
Three advantages:
Forces clarity. A chart can hide sins. A text summary makes you confront reality.
Detects anomalies. You might miss a 5% dip on a graph. An LLM instructed to “Flag any deviation > 3%” never misses.
It learns. Reply to the bot: “Why did churn spike?” It can trigger another workflow to query exit surveys and reply.
The “Command Room” State of Mind
Building this isn’t about saving 15 minutes of login time. It’s about shifting your psychology from reactive (chasing fires) to proactive (steering the ship).
When data comes to you, synthesized and prioritized, you stop asking “What happened?” and start asking “What’s next?”
That’s the difference between a Founder and a CEO.
Want to build this exact system?
In the Enterprise AI Sprint, we help your team build and deploy a custom Intelligence Command Room in 3 days. Real data. Real briefings. Real decisions.